CHAPTER - 8
Volumes Analysis for stocks
In technical analysis, the volumes or quantity traded play a vital role. The volume decides the significance of the price movement. Volumes indicate the number of shares bought & sold during the day. Let's understand how a volume is generated with an example.
At 9:30 AM, Mr.A bought 1000 shares of Tata steel at ₹1,200 & Mr.B sold 1000 shares of tata steel at ₹1,200. With these two transactions, the quantity or volume generated in tata steel will be 1000 & not (1000+1000) 2000.
You must be familiar with the term matching the orders, where buying quantity & selling quantity is matched. So in the above example, Mr.A & Mr.B together created a volume of 1,000. If at 10:00 AM, Mr. C bought 500 shares of tata stell at ₹1,250 & Mr.D sold 500 shares of tata steel at ₹1,250. The total volume generated will be (1,000+1,250) 2,250.

The volume data gains importance or will be helpful only if used with price action in the stock.
Let's understand this with the permutations & combinations.
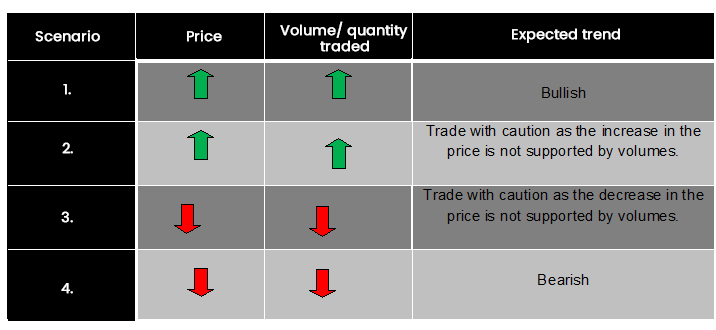
With the above table, we can conclude that in scenario 1- when institutional investors like a mutual fund or a significant market player like Mr. Raaakkkesh Jhunjhunwala buys shares of the company, they purchase a massive quantity of shares. In this case, the volumes will rise considerably, which will cause a sharp increase in the price. In the market, the moves by such institutional investors are considered significant & which generally copied by retail investors.
In scenario 2 – we can see that the price is increasing, but the volumes do not support it. This indicates that there is buying by retailers who buy in small quantities, but no significant player is involved in the buying. So, it would be best to be cautious while taking any long position in such a situation.
In scenario 3 - we can see that the price is decreasing, but the volumes do not support it. This indicates a sell-off by retailers who sell in small quantities, but no significant player is involved in the selling. So, it would be best to be cautious while taking any short position in such a situation.
In scenario 4 - - when institutional investors like a mutual fund or a significant market player like Mr. Raaakkkesh Jhunjhunwala sell shares, they sell a massive quantity of shares. In this case, the volumes will rise considerably, which will cause a sharp decrease in the price. In the market, the moves by such institutional investors are considered significant & which generally copied by retail investors.
Latest Top 10 Performing Funds
| Scheme Name | NAV on | Holdings | Returns (%) | Fund Manager | Rating | |
|---|---|---|---|---|---|---|
| Tata Nifty Pvt Bank ETF | 112.1161 | ₹ 953.7591472 Cr | 24.1384707538614% | Sailesh Jain | 1 | |
| ICICI Pru Technology Fund(G) | 53.41 | ₹ 35414.76052571 Cr | 23.1765904789635% | Sankaran Naren , Vaibhav Dusad , Priyanka Khandelwal | 2 | |
| Edelweiss ETF - Nifty Bank | 2047.9931 | ₹ 72.31 Cr | 22.3638817077987% | Bhavesh Jain , Hardik Verma | 3 | |
| SBI-ETF Nifty Bank | 202.4212 | ₹ 242503.74 Cr | 22.2708812094408% | Raviprakash Sharma | 3 | |
| Kotak Banking ETF | 205.2306 | ₹ 379580.55 Cr | 22.2131952311096% | Devender Singhal , Satish Dondapati | 3 | |
| Motilal Oswal Nifty Bank Index Fund-Reg(G) | 7.3638 | ₹ 4036.5684866 Cr | 22.0669674905138% | Swapnil P Mayekar | 2 | |
| Tata Digital India Fund-Reg(G) | 13.9041 | ₹ 34333.78900578 Cr | 19.4938524951637% | Meeta Shetty , Rahul Singh | 2 | |
| Aditya Birla SL Digital India Fund(G) | 51.49 | ₹ 38115.86 Cr | 19.046875% | Kunal Sangoi | 5 | |
| Kotak Small Cap Fund(G) | 61.52 | ₹ 124241.39 Cr | 18.6944214108026% | Pankaj Tibrewal | 2 | |
| Quant Small Cap Fund(G) | 38.9382 | ₹ 176.1202212 Cr | 17.7394878340161% | Ankit Pande , Vasav Sahgal , Sanjeev Sharma | 1 |
| Scheme Name | NAV on | Holdings | Returns (%) | Fund Manager | Rating |
|---|